
Candlestick Patterns Explained: 12 Classic Formations Every Trader Should Know
Candlestick patterns are a technical analysis tool that reads shifts in buyer and seller strength from a single candle or a combination of candles. Knowing the 12 classic patterns helps you judge potential reversal and continuation signals.
A candlestick chart is the most basic and most widely used way to express price in crypto trading. A pattern cannot guarantee direction, but it helps traders understand the current tug of war and make better decisions at key levels. Below are the 12 classic candlestick patterns every trader should know, and how to use them correctly.
Understand the Candle Before the Pattern
A single candlestick usually contains:
Open price
Close price
High price
Low price
The body shows the strength between the open and the close; the wicks show price being pushed and then pulled back. The key to pattern analysis is not memorizing names, but understanding: who was in control, who got pressed down, and whether the market's attitude has changed.
Bullish Reversal Patterns
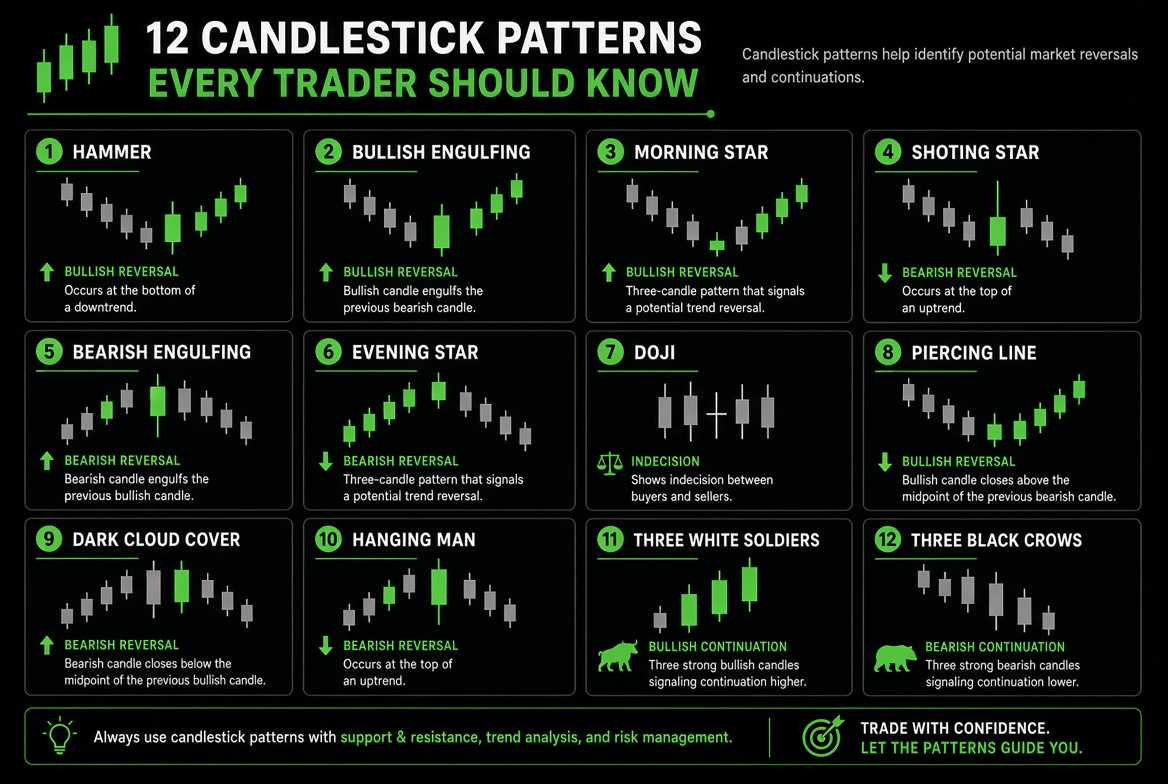
Hammer has a long lower wick and a small body, appearing after a downtrend, which means buying interest starts to absorb supply at lows. Watch whether a confirming bullish candle follows.
Inverted Hammer has a longer upper wick with the body at the bottom, and often appears after a decline. It shows there was an attempt to push higher, but whether the market truly turns stronger still needs confirmation.
Bullish Engulfing is a larger bullish candle that completely engulfs the body of the previous bearish candle, and it carries more meaning after a decline or near a support area. It shows bulls taking over the situation within a short time.
Morning Star usually consists of three candles: a large bearish candle, a small body, then a large bullish candle. At low levels it is often read as a sign that the decline is pausing and strength is returning.
Piercing Line is bearish first and bullish second, with the bullish candle pushing deep inside the previous bearish body. It is usually weaker than an engulfing pattern, but still reflects a rebound at lows.
Bearish Reversal Patterns
Hanging Man looks like a hammer but appears at highs within an uptrend. It shows selling pressure starting above, so watch for weakening momentum.
Shooting Star has a long upper wick with the body at the bottom, and appears after a rally. It shows a clear wave of selling after the price spiked.
Bearish Engulfing is a large bearish candle that engulfs the previous bullish body, and it matters more at a resistance area or after an uptrend. It is often read as a short-term weakening signal.
Evening Star is the opposite of the morning star: a large bullish candle, a small body, then a large bearish candle. At highs it hints that upside momentum may be running out.
Dark Cloud Cover is bullish first and bearish second, with the bearish candle pushing deep into the previous bullish body. It reflects rising selling pressure at highs, but is usually not as strong as a bearish engulfing.
Continuation and Indecision Patterns
Three White Soldiers / Three Black Crows are three consecutive bullish or bearish candles in the same direction, suggesting the trend may continue. If the bodies keep getting shorter or the wicks keep getting longer, watch for weakening momentum.
Doji has an open and close that are nearly equal, leaving a very small body. It represents a temporary balance between buyers and sellers, and carries more meaning at key support or resistance, but appearing alone does not mean an immediate reversal.
How to Use Candlestick Patterns Correctly
Read the trend first, the pattern second A single hammer inside a downtrend does not mean you should switch to long right away.
Combine it with key levels Patterns near support, resistance, or a breakout point are worth more.
Wait for confirmation Many patterns need the next candle or the closing result to confirm, so do not size up heavily just because the shape looks right.
Check the volume An engulfing or breakout on rising volume usually carries more weight than a signal without volume.
Tie it to risk control Every pattern should come with a predefined invalidation level. If the pattern fails, exit as planned.
Common Mistakes
Memorizing names without understanding what they mean for buyers and sellers
Trading a pattern that shows up at a minor, unimportant level
Ignoring the timeframe, since 15 minutes and a daily chart do not mean the same thing
Treating patterns as a 100% signal
Skipping position management, so one misread costs too much
Practical Tips
Daily and 4-hour charts are better for identifying more reliable structures
Patterns on small timeframes work better as entry aids, not as a standalone direction call
The same pattern has a different hit rate in a trending market than in a ranging one
Practice recognition first, then execution, and only then think about trading more often
Risk Notice
Candlestick patterns are only a probability tool and cannot guarantee an accurate forecast. The crypto market is highly volatile with many false breakouts, and a single pattern signal is not enough to form a complete trading system. This article is for educational purposes only and does not constitute investment advice. Always apply risk management and stay within what you can bear.
FAQ
**Q1: Do I need to master all 12 patterns?**A: Start by mastering 6 to 8 high-frequency patterns with clear logic, such as engulfing, the hammer, the shooting star, the doji, and the morning/evening star.
**Q2: How soon does a pattern take effect after it appears?**A: There is no fixed time. What matters is the timeframe it appears on and the confirmation that follows, not waiting on a clock.
**Q3: Are candlestick patterns the same in crypto and stocks?**A: The underlying logic is the same, but the crypto market trades 24/7 with bigger swings, so false signals tend to be more common.
**Q4: Can I trade on a single candle?**A: You can use it as a reference, but it is better to combine it with position, trend, and confirmation signals. Deciding on a single candle alone is high risk.
**Q5: What is the biggest value of learning candlestick patterns?**A: It helps you understand the shift in buyer and seller strength, cut down purely emotional buying and selling, and build clearer entry and invalidation criteria.
Recommended
View more